
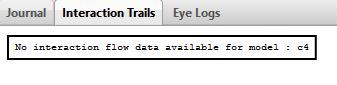
Interaction Trails
This section shows a sequence of interactions which have occurred on the selected model as a result of
standard Backbone write operations - save, fetch, set, destroy, reset and sort among others. The trails has
a graphical section which shows overall flow characteristics at a glance. The tabular section - on the other
hand - shows the state of the model at various time points of the flow (as well as parameters which were
passed in at that time point). This would be useful to work backwords to infer observed application
behavior.
Note Also works on selected collection and view.
Note Read operations are deliberately not shown as they don't change application state (and will only contribute to investigative noise). In future versions, we may have an option to switch on this behavior.
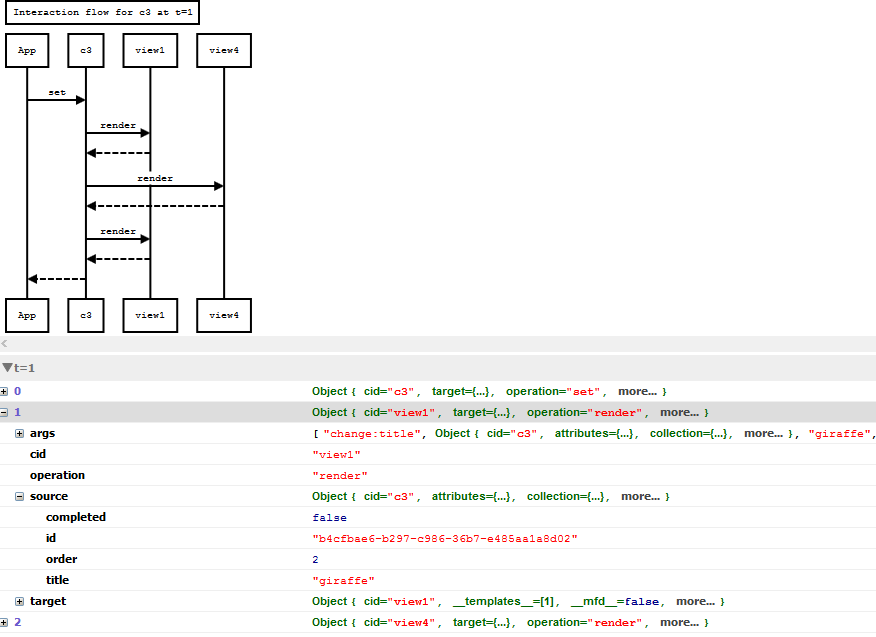
The view shows the interactions which have happened at time t = 0, 1, 2 ... n. To view a interaction at t = m, click on the t = m header. The interaction trail is updated to show the flow at t=m. Expand the t=m section to see detailed info about the state of various participating entities, message name and parameters. By default, the last interaction is shown when you navigate to the interaction trails view.
Note Also works on selected collection and view.
Note Read operations are deliberately not shown as they don't change application state (and will only contribute to investigative noise). In future versions, we may have an option to switch on this behavior.
The view shows the interactions which have happened at time t = 0, 1, 2 ... n. To view a interaction at t = m, click on the t = m header. The interaction trail is updated to show the flow at t=m. Expand the t=m section to see detailed info about the state of various participating entities, message name and parameters. By default, the last interaction is shown when you navigate to the interaction trails view.
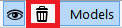
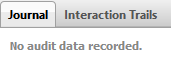
Clear Interaction Trails and Journal data
For complex applications, this data can grow and Backbone Eye can become sluggish. Click on the clear
button to reset this data.
This will cause both the journal and interaction data collected so far to be wiped out.
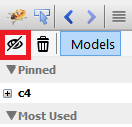
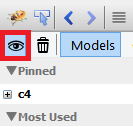
It is also possible to not record this data altogether. Toggle the eye button to stop or start recording this data
Tip Leverage this feature in real applications to improve debugger performance. Switch off recording and load the application URL. When you want to watch interesting (or weird perhaps!) application behavior, start recording.
This will cause both the journal and interaction data collected so far to be wiped out.
It is also possible to not record this data altogether. Toggle the eye button to stop or start recording this data
| Not recording | Recording | |
 |
 |
Tip Leverage this feature in real applications to improve debugger performance. Switch off recording and load the application URL. When you want to watch interesting (or weird perhaps!) application behavior, start recording.